Ask a product organization how long its next development project will take and you will get a schedule. Ask how long it should take and the room goes quiet. The first question has an answer in everyone’s planning tool. The second question needs a reference the organization usually has not built: a cycle time metric, a phase-by-phase statement of how much time the work deserves in the hands of a world-class team. How long do the fastest teams take to define a product? To tool it? To validate it? How long does your competition take? Until those numbers are on the wall, every schedule is grading its own homework.
The metric is simple to state. Take the project from start to ship, divide it at the same few milestones every project passes, and assign each phase the time the evidence says it should take: your own fastest history, the best teams you can observe, the competitors whose launch cadence you can count from the outside. The result for one recent client’s new product portfolio was a 12-month model: one month to Product Defined, three to the tooling order, four through tooling, two of validation, two of inventory build. Other businesses will set other numbers. The phase cut matters as much as the total, because a single end-to-end number only tells you that you are slow; the phase comparison tells you where, and where is what you can fix. And the numbers must come from evidence of what has been done, not from averaging what your own schedules already say. A metric built from your own averages only certifies the status quo.
Two reference points, two different questions
We already hold every schedule against one reference point: the target. Targets come down from strategy, as we argued in Where targets come from and Targets are top-down; schedules are bottom-up, and they answer one question: when does the business need this? The cycle time metric is the second reference point, and it answers a different question: how fast can this work go? The two are independent, and that is their value. A plan can sit comfortably inside a soft target while running at half the speed the work deserves, and the target comparison will never catch it. A plan can run at world-class pace against a target the market set impossibly, and the metric comparison is what tells leadership the problem is the target, not the team. Read together, one instrument tells you whether you will be on time and the other tells you whether you are fast. Those are not the same thing.
The metric at fab scale
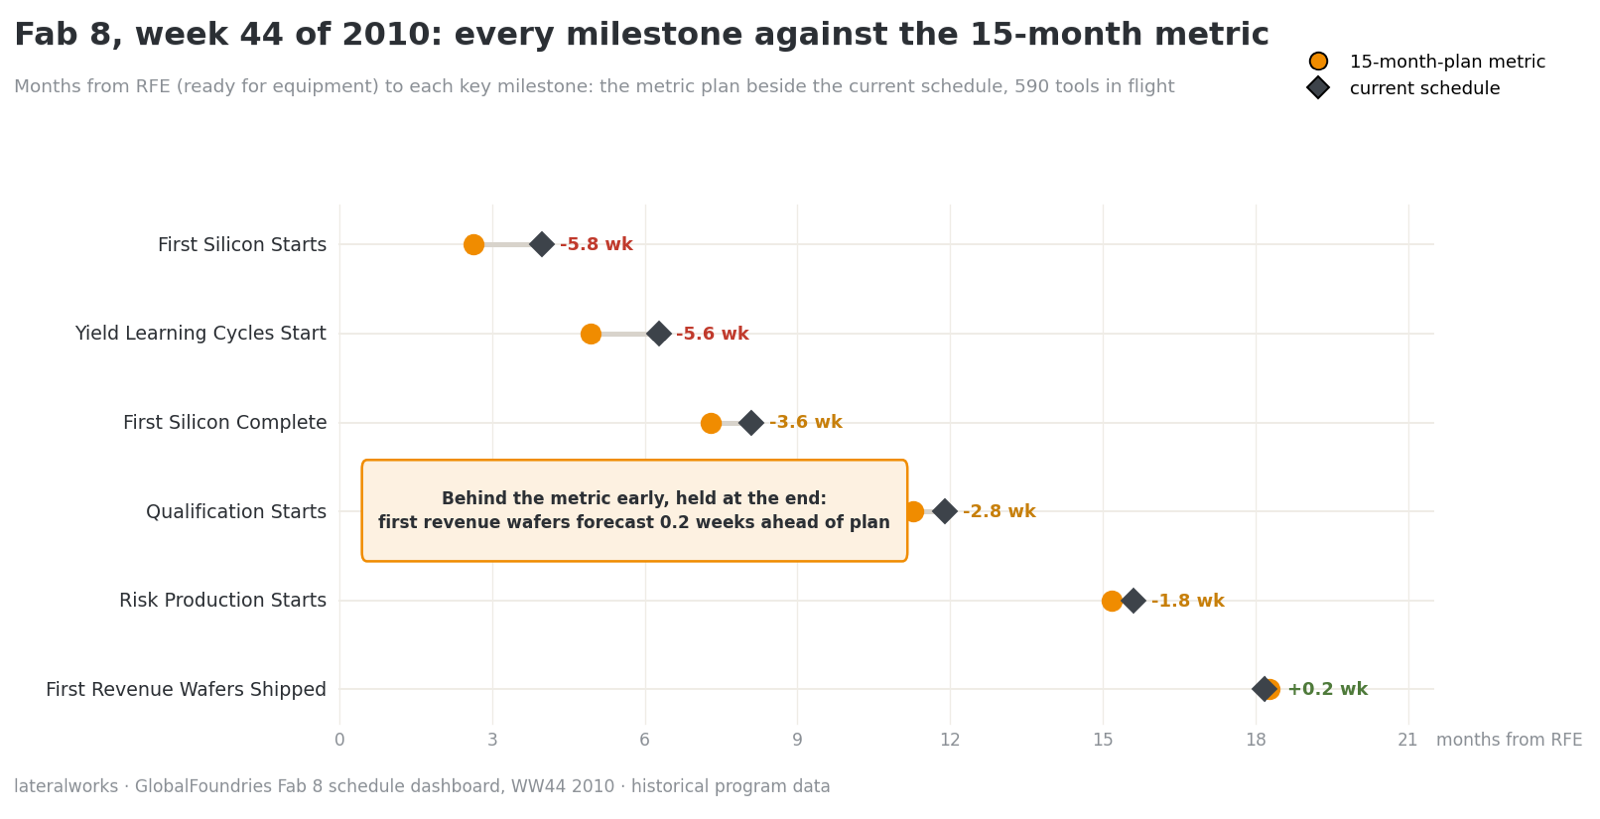
We have run this discipline for years on semiconductor fab programs, where the milestones are famous and the world-class timings are known: compare the cycle time to each milestone against the fastest fab start-ups on record. At GlobalFoundries Fab 8, a $7 billion fab built in under two years against an industry average of three to four, the program dashboard carried the comparison on page one: every key milestone, from first silicon starts through first revenue wafers, measured in months from RFE (ready for equipment) against the 15-month plan, with the gap in weeks beside it. In week 44 of 2010, with 590 tools in flight, the early milestones ran up to 5.8 weeks behind the metric and the program still held its final one: first revenue wafers forecast 0.2 weeks ahead of plan. The program finished two weeks early and avoided roughly $70 million in delay costs. The team achieved first silicon in under 24 months, at the time a record cycle time performance for a fab start-up. Ten years later we beat that record by six months on a fab program in China: 18 months to first silicon. The metric moved because the evidence moved, which is exactly what a metric should do.
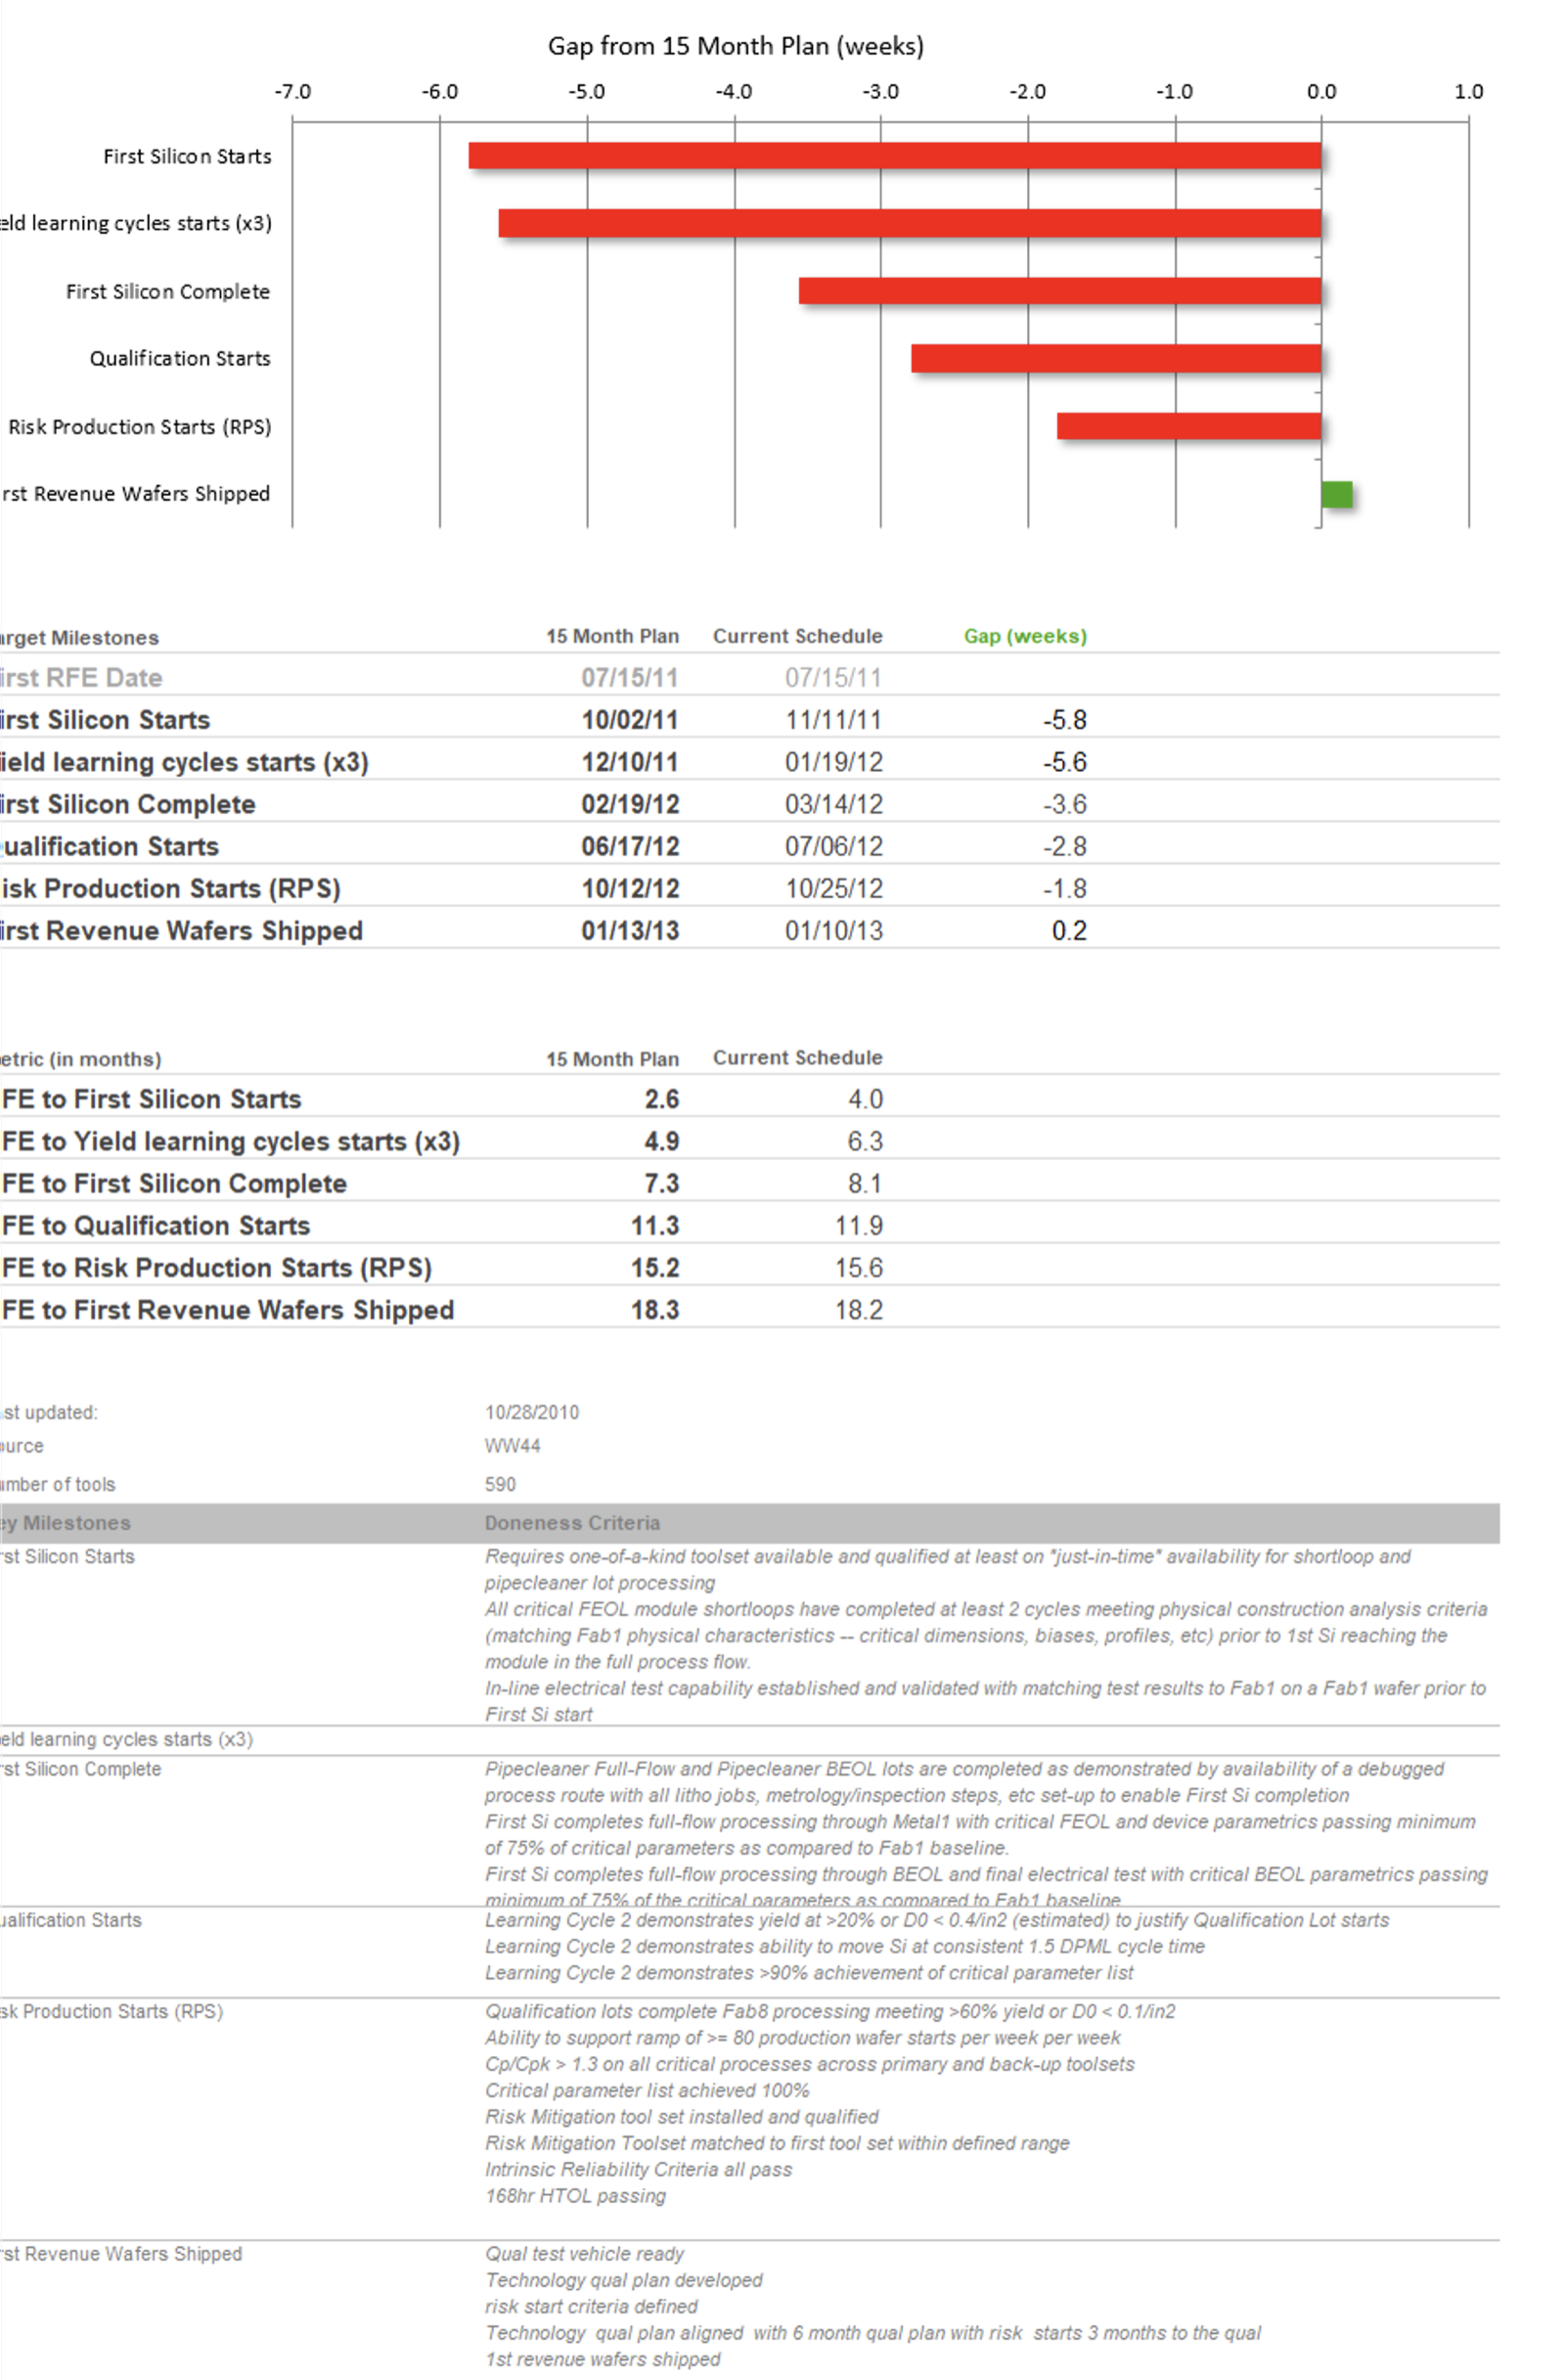
Two details of the fab practice carry over to product development. Every milestone on that dashboard had written doneness criteria, because a milestone you cannot define is a milestone you cannot benchmark. And the comparison ran weekly on the live schedule, not annually on a retrospective, so a widening gap was a management signal while there was still time to act on it.
The comparison now takes an afternoon
The reason most organizations never build this instrument is mechanical: comparing eleven project schedules phase by phase against a reference model used to be weeks of analyst work. We built a Claude skill that does it directly. It extracts the Microsoft Project files our clients build in fastProjectAI, turns each .mpp into data Claude can read, maps each metric phase to named boundary tasks in the schedule, and measures the planned time between them. It validates its own extraction by recomputing every schedule forward and backward through the dependency network and checking the result against the stored dates. Then it writes the study: one page per project, a portfolio page, and the conclusions. The same automation discipline behind our initiative reporting applies here: nobody builds the comparison by hand, so the comparison actually gets built.
What eleven schedules said
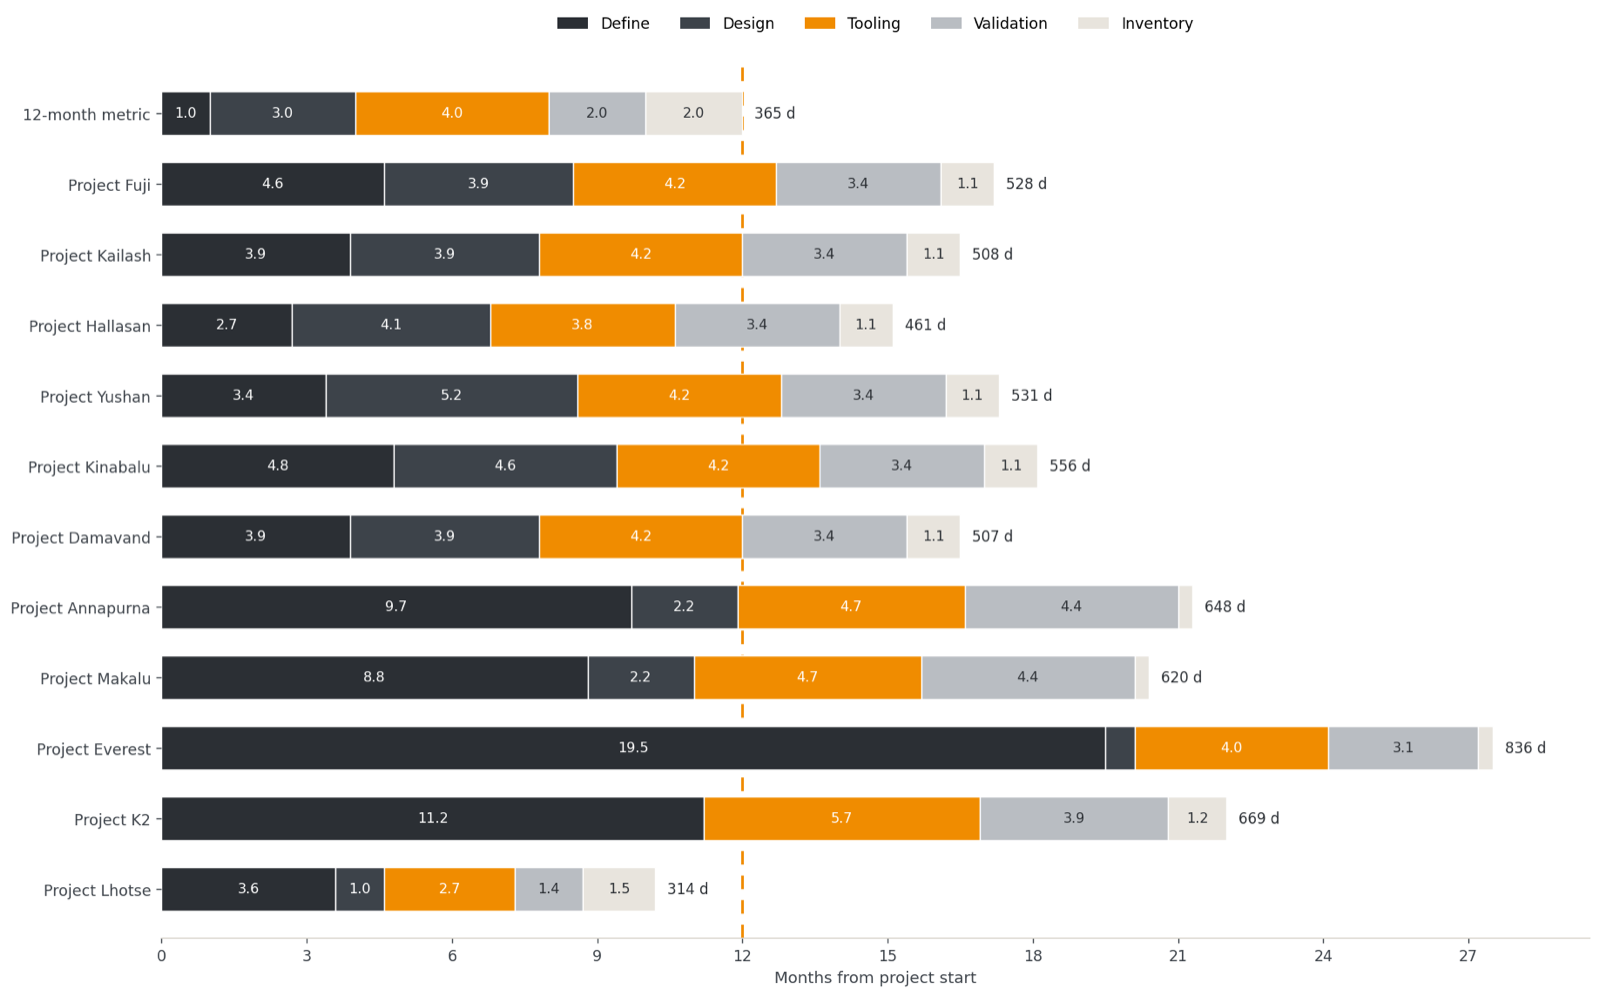
The study attached below is a portfolio of new product projects, eleven schedules against the client’s 12-month metric: six template plans (the standard plan each new product starts from) just started, and five gated programs already in flight. The portfolio averages 18.5 months start to ship, 1.5 times the metric. The interesting finding is where the time is not. Tooling runs 129 days in five of six template plans against the metric’s 122. Validation runs 105 days in all six. Inventory runs 35 days against an allocation of 61. The back half of every plan already runs at or near the metric’s pace, because the contract manufacturer controls those phases and the contract manufacturer has done this work a hundred times.
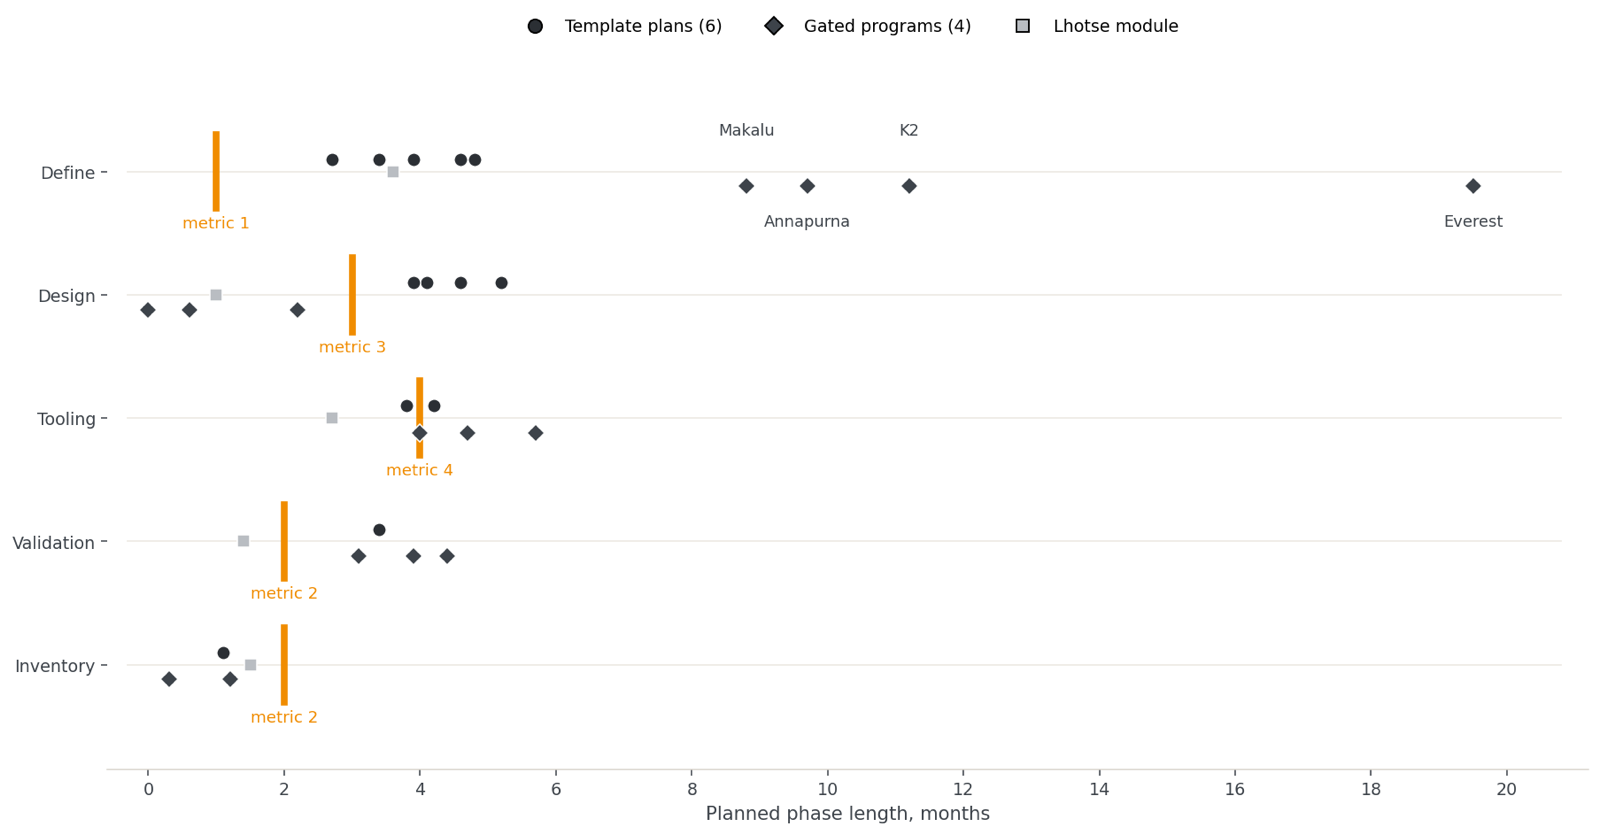
Every gap in the portfolio concentrates in one phase. Define runs 2.7 to 4.8 months in the template plans and 8.8 to 19.5 months in the gated programs, against the metric’s one. Define carries 44 to 67 percent of each template plan’s total gap. The study’s bottom line states the diagnosis in two sentences: the organization already plans the metric’s back end. It has not yet planned its front end. And because the six template plans are one plan downstream of Define, the fix is made once, in the template, not six times in six projects.
The challenge runs both ways
A metric comparison is not a compliance exercise, and the plans are not the only party under examination. The same study flagged the metric’s own weakest number: the two-month validation allocation, which no plan in the set, template or gated, comes near. Either the metric is right and the validation blocks need restructuring, or the plans are right and the metric needs a third month. That question goes to the challenge process like any other assumption. This is bimodal thinking applied to benchmarks: the metric and the plan are both legitimate and neither is correct, and each exists to expose the error in the other. The research says the same from the other direction: inside-view estimates run optimistic on the work and conservative on the possible, which is why Lovallo and Kahneman prescribe the outside view, judging your project against a reference class of comparable ones. The cycle time metric is the outside view, standing on the wall, updated whenever the evidence improves.
How to stand it up
The practice fits in four moves. Name the milestones every project passes, with doneness criteria, so phases are measured between defined events. Set each phase’s allocation from evidence: your fastest history, the fastest teams you can observe, competitive launch intervals. Run every schedule against the metric on one axis, template plans and live programs alike, and rerun it on every schedule save, because the drift between saves is management information: in the three days between two saves of this portfolio, one plan grew 14 days in Define while another cut 54. And read it beside the target comparison on the weekly trend, so every project answers both questions every week.
The first move fits in a half-day workshop: name the milestones and set the first allocations from the evidence in the room. Perfect numbers can wait. A wall the teams can argue with cannot, because the argument is the point: every challenge to the metric either improves a plan or improves the metric.
Targets tell you when the business needs it. The metric tells you how fast the work can go. A schedule owes an answer to both, and a leadership team that holds only the first will approve slow plans on time, year after year, without ever knowing it.
References: Lovallo and Kahneman, “Delusions of Success: How Optimism Undermines Executives’ Decisions,” Harvard Business Review, 2003. Flyvbjerg, “Quality Control and Due Diligence in Project Management: Getting Decisions Right by Taking the Outside View,” 2013. Smith and Reinertsen, Developing Products in Half the Time, Wiley, 1998.
Related reading: Where targets come from, Targets are top-down; schedules are bottom-up, Ten numbers on two clocks, Targets and Trends, Bimodal thinking, Core Speed Concepts, Managing corporate initiatives, and The FTTM execution system.