Prioritize Public Policy
/
focus on where to get the greatest value, given changing revenue forecasts to determine impact on policy decision-making
In preparation for a meeting with the then new Mayor of Sacramento, Kevin Johnson, we developed the following decision-model example, responding to the question, "Which combination of initiatives generate the greatest value, in order to fulfill the goals of the new administration?" This is somewhat dated today, but the concepts are relevant to any policy decision making, regardless of the timing.
We wanted to illustrate that we could use decision-modeling to focus public policy on where to get the biggest bang for the buck.Reconciling the gap between expectations and what one can afford is all too often ignored when setting public policy. Unlike the federal government, large City's (or States) can't print more money and "deficit spend" their way out of the crisis of diminishing revenue.
So how can they make the trade-offs between COST, VALUE, and the INITIATIVES that they promised to deliver during the campaign? More bluntly, can they still afford their promises now? What impact does the current economic situation have on the "change agenda?"
Framework
We used Mayor Johnson's "Day One" outline of what he would do and how he would do it. It is an excellent plan that is well structured. It uses a great goal and action format to organize the areas he plans to change. It was an almost one-to-one fit for the decision model. Well done Mayor!

What is it?
This is part of the meeting "brief" we prepared for Mayor Johnson. It was a…
Way to logically prioritize alternatives in order to determine the most cost effective solution to a problem.
Transparent, rational decision-making process that brings all the stakeholders together to simulate and explore solution paths.
Reasoning process to more effectively make the hard choices about what to cut and what to focus on, in the context of shrinking revenue and ever increasing public service needs.
Way to accelerate the consensus process with all the stakeholders to rapidly converge on solutions.
Examples of how it can be used:
Prioritizing "Kevin Johnson’s Action Plan for Sacramento" and effective distribution of Federal Stimulus Funds; in both cases, determining where investments will achieve the “biggest bang for the buck” in order to realize administration objectives.
Further, this is a demonstration and the ranking is fictitious. We made-up the ranking values while "playing Mayor" in order to illustrate and validate the process (in our own minds). The content however is KJ's, but the ranking is ours.
We've used this method on complex technology investment problems, product portfolio management, VOC requirements prioritization, but not on a public sector problem. We were satisfied, based on this study, that it could work perfectly.
Structure the Problem
We built this decision map (above) to clearly organize Mayor Johnson's Day One plan onto a single page. Typically this mind mapping process is facilitated with groups and the graphic interface makes it easy to see the complete plan and the hierarchical relationships of its parts. KJ's plan was well thought out since it cleanly mapped to this format. I also like how each of his Objectives had a measurable Goal. This would be a great structure for any mayor of a large city to adopt.
This decision map illustrates the structure of the decision model; Overall Goal, supported by Objectives (with measurable results), and then a series of alternatives designed to achieve the Objectives... hopefully in order to realize his Goal (or vision). In this case the alternatives were specific initiatives organized in categories such as Crime, Schools, and the Economy. I also like that each initiative has a VERB in it which defines the action he is expecting to achieve.
Prioritize Initiatives -- with no constraints
We did a pairwise analysis to determine the relative importance of the objectives. It was an interesting process to compare, for example, boosting the economy versus a greener Sacramento. Which was more important with respect to the Mayor's goal? I think the answer to these questions have changed since the campaign last year... in these first 100 days of his administration. The tanking economy must have a significant impact on his plans, but in what way and how?

Pairwise ranking model of Objectives vs Goal/Mission statement
This is typically a facilitated group process that generates extensive debate and discussion. It is critical to being able to properly translate what an executive group wants to emphasize, in terms of strategy, and how this influences the prioritization of initiatives. This is perhaps the most important step and most interesting in terms of human dynamics. It is one way of getting everyone "on the same page."
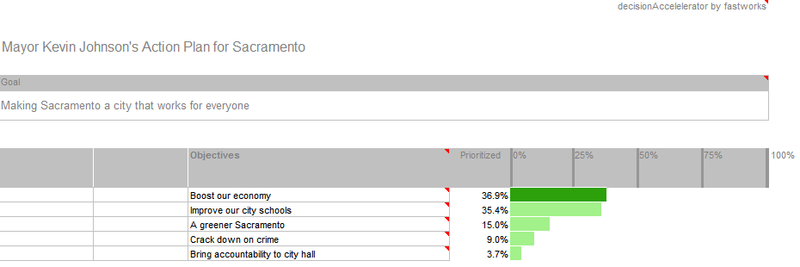
results of pairwise comparisons
The result of the pairwise analysis is a prioritized list of objectives (above). In "my city," it looks like we'll have a good economy, smart kids, and a low carbon foot print! Wonder how this would have looked a year ago? This weighting influences the ranking of the initiatives. Move Crime up and the Economy down and the priority of the initiatives change. This is the power of having the data in this form in terms of getting a group of non-like-minded stakeholders to "play the game"and interactively explore potential solutions.
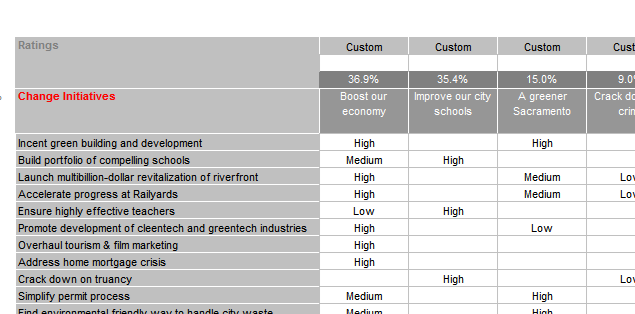
ranking change initiatives
Next we ranked each alternative (or in this case "initiatives")against a simple high-medium-low QFD scale (above). For example, how much did green building influence "boosting the economy?" The ranking generated a prioritized list of initiatives (above).

result of initiative ranking
In "my city" these would be my administration's top ten change initiatives; Green, Schools, and the Economy(above). The ranking of what I would focus on is driven by the priority of my objectives. But of course, continuing my fake role as Mayor, I might try and do all of these things without considering the critical constraint of how much this stuff might all cost.

completed decision priorities
If I was in Washington (or at AIG) perhaps I could get away with this thinking, but as a large city Mayor I know that I am constrained by my budget and I can't legally run a deficit.Further, I also remember that I campaigned on open and transparent government decision-making, so lets now consider some constraints.
Considering Constraints
In my fictitious city, it would cost about $340M to fund all my "change initiatives." Clearly I have a lot less to work with and this number is decreasing each tax cycle as less and less tax revenue is being generated due to the down-turning economy. I am under serious pressure to reduce spending and only spend on essential services. I have a growing "tent city" problem and clearly this is an emergency. How does this impact my change agenda? What should we keep and what should we cut?
cost-benefit analysis
Looking at a cost-benefit study of my plan above I can see that for about $164M I can achieve about 80% of my benefit for only half of my budget.Below the curve are the initiatives I can fund at this budget point. Not bad, spend half as much and achieve 80% of my goal! But my budget is being cut even further due to a decreased revenue forecast in my fake city. I only have $100M to work with this year. How does this impact what I can do? What should I focus on now?
Yellow indicates initiatives that get funded based on $100M budget, results in 65% benefit
With a $100M budget limit I can't do three of my top five initiatives. Schools, the Waterfront Revitalization, and the long awaited Rail-yard Project must be delayed (above). The initiatives in yellow get funded, the others don't given my budget constraint. Notice (in red) that this portfolio mix of initiatives only achieves 56% of my most important objective of boosting the economy. My overall benefit projection with this mix is only 64%, on the good side I only need $98 million. Not a great set of options given what I am trying to do to change the city and have a long term impact on its future.
Given that I feel the Waterfront Revitalization and Rail-yard projects are critical to the economic success of my city and for that matter the Sacramento region, I am going to override the cost-benefit analysis and force these projects to get funded (i.e. they are must haves). But look (above) at what this does to my overall benefit estimate, dropping it down to 34% and my objectives take an equally bad hit, all dropping below 40%. Further, this portfolio mix really impacts my Green program and virtually kills my efforts to revitalize the Sacramento school system, which is really my passion.
This is a great example of the classic trade-off public policy makers face today--invest in the future (low carbon foot-print and kids that grow up able to think) versus near term economic gain. President Obama is making an interesting attempt to apply the "no-trade-off" policy--he seems to understand the holistic "interconnectiveness" of all the moving parts, yet he also is playing with the third variable (cost) in terms of how much deficit spending he can get our foreign investors to sustain and for how long?
But in my city, I don't have the luxury of this variable. I have to balance my budget, I can't print money, and I can't run a deficit. I have to make hard choices about what to fund and then understand how these choices impact what I set out to do in terms of changing my city. Clearly, better tools and methods are needed to bring the sides together to rationally work through the alternatives and make the results transparent to the public. Given the recent AIG revelations, the honeymoon on "transparency" seems to be coming to an end.
Finally, below are some other studies we did with the model to explore what would happen if one objective was emphasized over the others. The first example is the prioritized list with my "Green" objective as the driver. The dark blue is the winner. I left them in the same order that was driven by my prioritized list of objectives so you could see how GREEN changed the ranking of initiatives. The second study below suggests that CRIME is the driving objective and the model re-prioritizes the initiatives accordingly.
Also see: