At the September 29 refresh, nine of the program’s fourteen initiatives forecast late, and six of them sit more than four weeks behind. A conventional red-amber-green dashboard would ask leadership to triage nine problems in a one-hour review. The exception page asks them to look at five. The difference between those two numbers is the whole argument of Report by exception, the white paper behind this article. This is the short version.
The program is a fourteen-initiative margin improvement portfolio, illustrative and built from synthetic data, tracked the way a fastProjectAI program is tracked: a native Microsoft Project schedule and a wigglechart workbook, refreshed weekly. An initiative here is a project in its own right: fourteen projects under one program, each with an owner, a plan bar and a target marker, and none large enough to justify its own steering committee. The page below is the entire report.
The exceptions are not the late ones
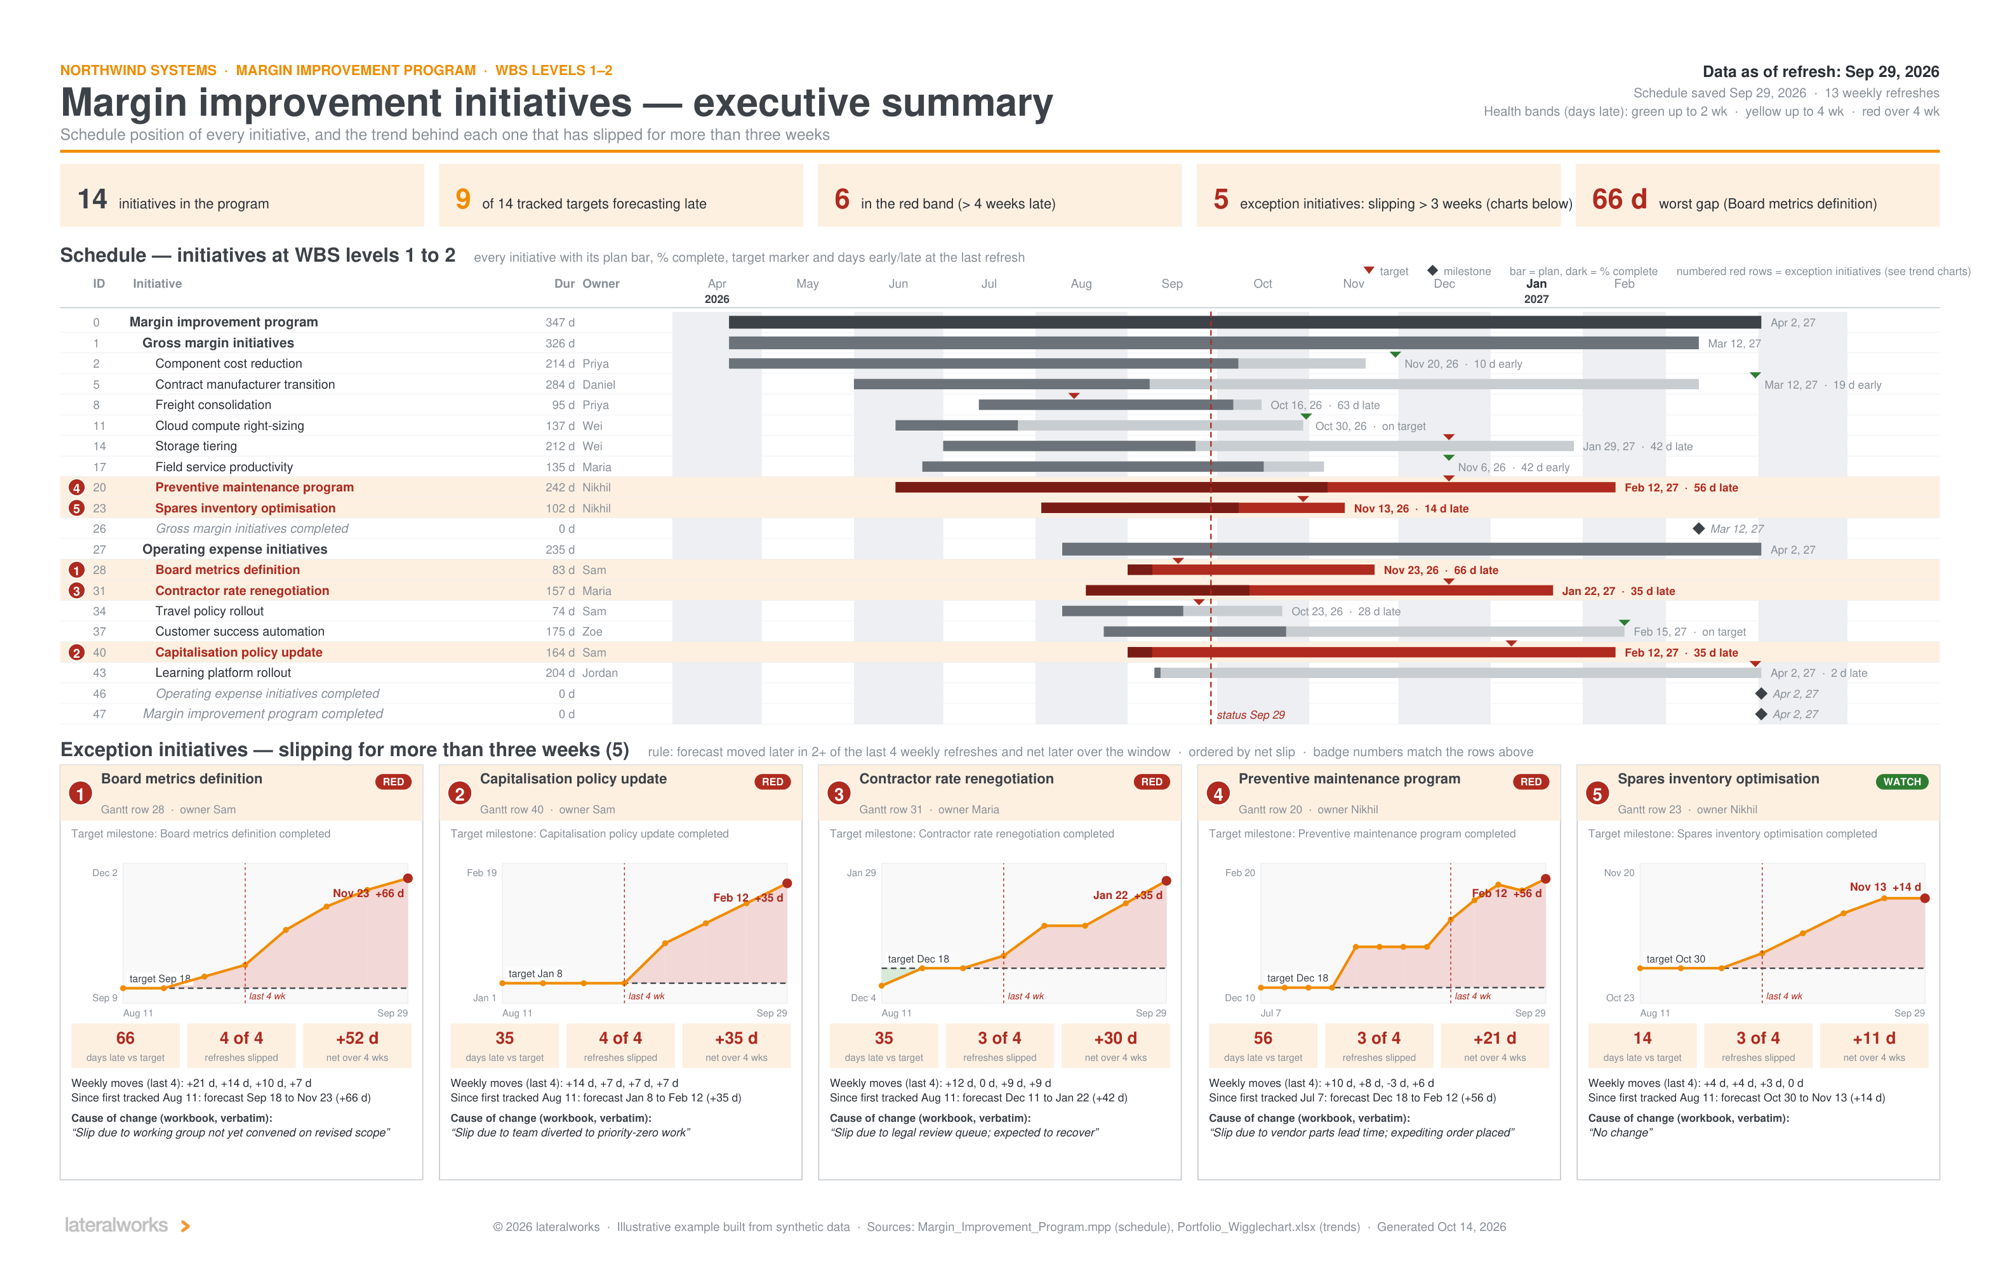
Read the headline strip left to right: fourteen initiatives, nine forecasting late, six in the red band, five exceptions, and a worst gap of 66 days. The fourth number is smaller than the second and the third, and that is the point. An initiative is an exception when its forecast completion date moved later in at least two of the last four weekly refreshes and finished the window later than it started. The rule reads the pattern in the forecast, not its current value.
Two initiatives on the page show why that distinction earns its keep. Spares inventory optimisation is only 14 days late and would be yellow on any conventional page, yet it is exception 5 on the page, because its forecast moved in three of the last four weeks. Freight consolidation is 63 days late and would be the reddest row on the page, yet it is not an exception, because whatever happened to its date happened before the window opened. One of those is a problem leadership can still influence. The other was decided weeks ago.
Why colors fail and dates do not
The research on status reporting says the conventional dashboard cannot be saved. Keil, Smith, Iacovou and Thompson reviewed fifteen years of studies and summarized them as five inconvenient truths, among them: executives cannot rely on staff to report status accurately, and they frequently ignore the bad news they do receive. Social psychology named the underlying habit in 1970: the MUM effect, the reluctance to pass on unwelcome information. A status color is the perfect host for it. The color is a judgment, the judgment belongs to the person being judged, and the only evidence behind it is a conversation.
A forecast date in a weekly schedule refresh is a harder thing to shade. It comes out of the critical path, and it is recorded every week whether or not anyone wants to talk about it. The exception page is built on those dates and only on those dates. Nobody rates anything.
None of this is a new idea. Frederick Taylor described the exception principle in Shop Management in 1903: the manager should receive only condensed, comparative reports covering the exceptions. His version needed a clerk to decide what counted. This one needs a rule, written once, printed on the page where anyone can argue with it. We made the same argument for product portfolios in 2019: aggregate every project into one view, then drill down by exception. The Gantt is the aggregate. The trend charts are the drill-down.
Generated, not assembled
The page took no one any time to lay out. Each week the schedule file and the wigglechart workbook go into a Claude skill that extracts the schedule, applies the rule to the trend history, draws the Gantt, and lays out one trend chart per exception, with the cause of change quoted verbatim from the workbook. A verification script recomputes every number on the page from the source files and refuses to release it on any mismatch. A report someone assembles by hand each week drifts; a generated report cannot, and when it is wrong, it is wrong in a way that traces to a cell.
The verbatim rule matters as much as the gate. The skill may not paraphrase, summarize or soften the cause of change; it copies the cell. Exception 5’s cause reads, verbatim, "No change," against a forecast that drifted eleven days in a month, and the emptiness is the finding. Either the owner has not looked at the schedule or there is a problem the owner has not named. Either way it belongs in the room.
The meeting the exception report is built to run
Leadership reads the strip and the Gantt in two minutes, confirms nothing has been hidden, and spends the hour on the exceptions in badge order. Every one gets the same five questions:
Five questions for every exception
1. Is the trend improving?
2. Which path is pushing the date out?
3. What does the team need from the people in this room?
4. What has the team already done on its own authority?
5. Does the ask leave this meeting with an owner and a date?
The first three have anchored lateralworks exception reviews since 2019. The last two come from the page itself: the trend chart shows what the team has already done, and the meeting rule in the paper is that no ask leaves without an owner and a date.
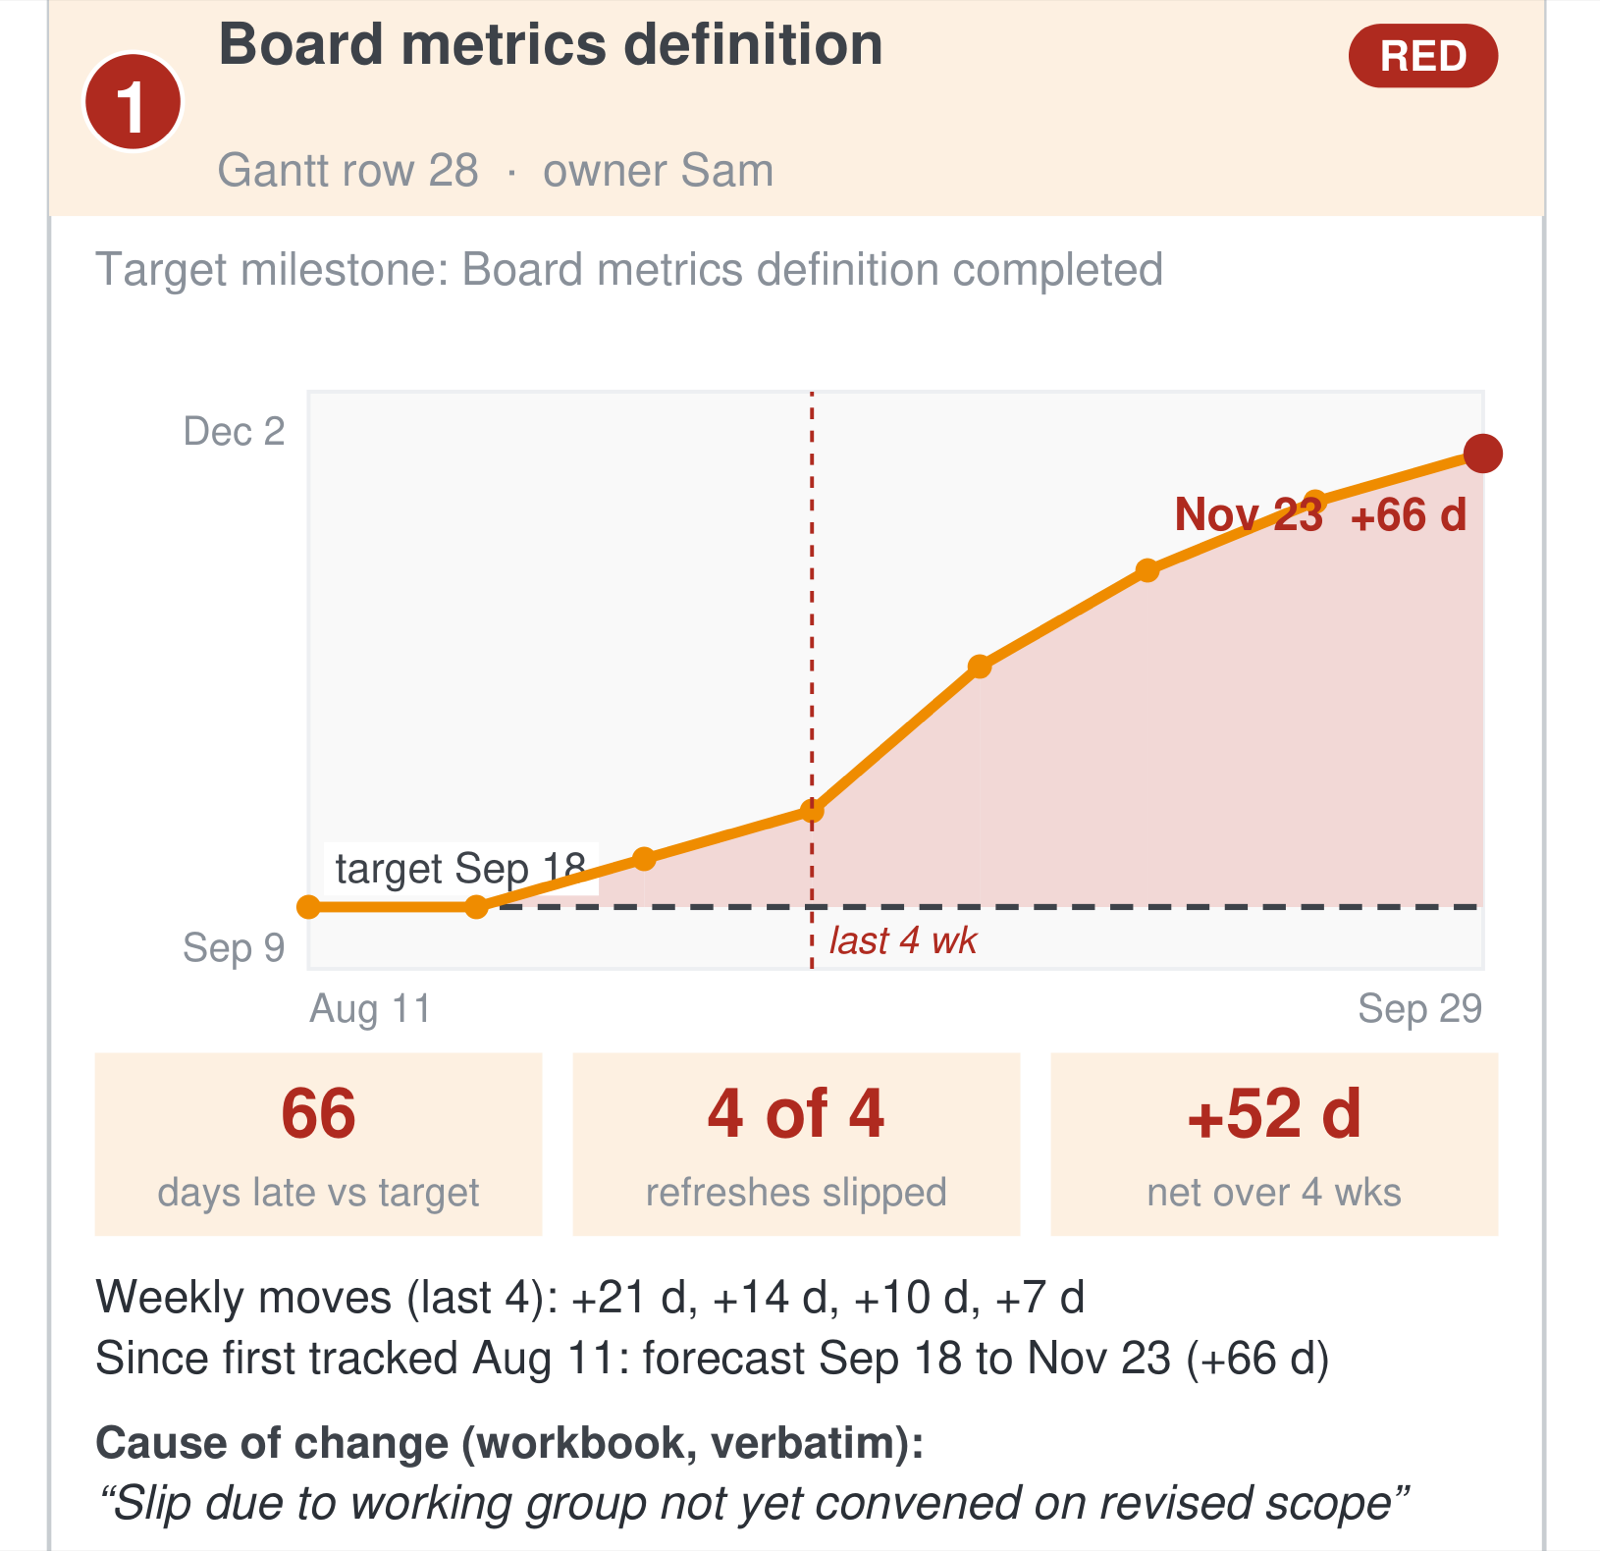
The trend charts answer the first question before anyone speaks. Exception 1 slipped in four of four refreshes, but the moves are shrinking: 21 days, then 14, 10 and 7, and the stated cause is a working group not yet convened. That is 66 days of slip with a calendar remedy. Exception 2 is a metronome, 7 days of slip per week elapsed, which is what a stopped project looks like; the real question is whether the diversion that stopped it was a decision anyone made. Exception 4 shows a 3-day pull-in in week three, because the team placed an expediting order and said so. One needs a meeting scheduled, one needs a priority call examined, one needs the expedite funded.
Two disciplines hold the whole instrument together. The target never moves, because a fixed target is what makes a forecast trend readable at all. And the practice that keeps initiatives off the page is pull-in: find schedule gains in the weekly refresh ahead of the problems that will consume them. A program that runs the refresh well should watch its exception count fall, and the page makes that visible too.
The full paper walks the page, the rule, the pipeline and the meeting in sixteen pages. The one-page example is attached below, full size.
References: Keil, Smith, Iacovou and Thompson, The Pitfalls of Project Status Reporting, MIT Sloan Management Review, 2014; Rosen and Tesser on the MUM effect, 1970; Frederick Taylor, Shop Management, 1903; all linked above. The full white paper is Report by exception.
Related reading: Aggregate, then Drill Down, The Weekly Schedule Refresh, Targets and Trends, Where targets come from, Pull-in before you slip, Do tighter control systems create faster projects?, Ten numbers on two clocks, and A fishbone built from the record.