
Operationalizing business strategy in your project portfolio
/
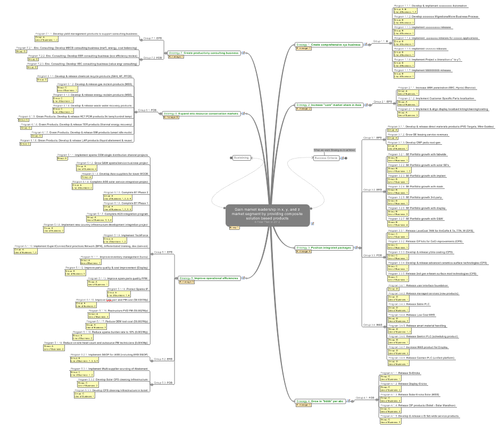
Strategy mindmap to product portfolio (example)
This example illustrates the process of mapping strategy and then setting program priorities. The key is to link strategy formulation with the means to realize the results (i.e. execute). It illustrates the linkage between vision-strategy-program.
In this example we; a) mapped the current strategy (we organized and normalized an existing strategy around a common structure), b) prioritized the strategic initiatives based on four "success criteria," and c) prioritized about 100 programs/projects spread across four business units. The followingexample has been modified to protect client confidentiality.
We did not, in this case, rationalize the strategy (i.e. align strategy/programs to the vision) or rationalize the portfolio based on constraints (i.e. align and optimize the portfolio mix based on available resources).
Map Strategy
We started with a map of the vision, strategies that supported the vision, and programs/projects that supported each strategy. All four business units had organized their business plans differently. The process of normalizing their information in an integrated map reveled a number of holes and inconsistencies in the information.

Top level of the strategy mindmap
Since we were not trying to "evaluate" the quality of the information, we were just trying to "locate it", we did not spend much time determining if the strategies were sufficient to drive the vision outcome nor if the programs were sufficient to fulfill each strategy outcome.
We were starting at Stage 1and wanted to structure what they had already done and use this as the basis for continuous improvement once the management team came on board with the approach. The first step in this process was to structure the information so that it could be understood, subsequent phases of their deployment would improve the strategy formulation process. But we decided to take one step at a time and invest the time to gain acceptance and executive involvement in the improvement process. Further, mapping and prioritizing the existing business plan was a great step forward to improving communication between the executive team and making the 4 year planning process more transparent.

Each strategy was supported by a series of programs or projects. The programs were the way in which the strategies were deployed. One failure of many strategic planning is that there is no link between strategy elements and the means to execute. The programs, in the map, support the execution of the associated strategy. Are these the right programs? Do these programs cause the strategy to be realized? What are the most important programs that drive the strategy execution? More fundamentally, are these the right strategies the will enable the vision to be achieved?
We could view the map by business unit (group), by strategy, and by the line of business (i.e. their customers in this case).The map, when built out gave a visual illustration of where the majority of the programs were concentrated. It also showed where strategies were lacking supporting programs, making them unlikely to be deployed.

Prioritize Strategy
The mapping process set a hierarchical structure around which the information from the four business units could be organized. We automatically transferred the map to the decision model. Then built a prioritization model and engaged the executive staff in determining the priorities of each strategy, we wanted to know which strategies were the most important drivers in order to make sure those programs were fully funded/resourced and emphasized.


Through a series of iterative working sessions with executives, they ranked their "success criteria." These weightings would drive the ranking of the strategies and establish the core drivers for the business. This generated a lot of debate and in the process caused alignment across the executive group. Each of the strategies was then ranked using a simple 1-5 criteria. You can see the top three strategies that most contributed to achieving the success criteria, which would intern drive the Goal.
Prioritize Programs
Let’s drill down into one of the four business units (Group A). The same macro success criteria weighting was transferred down to the program model (i.e. Grow CP$... 40%, Grow Revenue... 30%, etc.). In this example you see Group A's programs that are associated with the first strategy "Create comprehensive..."
Each program was ranked using a more detailed rating criteria. The result was a prioritize list of programs.
These are Group A's programs across the three strategies that they impact.

This process was done on about 100 programs across each of the strategy categories. We studied the results of the aggregate program priorities and also drilled into each group (business unit) to determine the ranking of just their group's programs to one another. Each group's management team further refined this ranking to end up with the top 10 programs across the business and the top 5 programs for each group respectively.

Finally we ran a series of studies to determine the contribution each group was making to the overall strategy objectives. For example, looking at just Group A's programs across three strategies we can see the yellow highlighted rows are the programs that drive the "Create comprehensive xyz business." These seven programs represent about half (49%) the total contribution (i.e. sum of the seven program's priorities).
Further, in red we can see how these 7-programs contribute to each of the four success criteria. For example, the 7-programs contribute 54% to Growing CP$ and 63% to Growing Revenue. Contrast this with the single program that drives "Improving operational efficiencies" and how little this program continues to any of the business objectives.

This analysis was done within each business unit to further refine the program mix that would best achieve the business objectives. The client has gone on to expand the deployment to Stage 2 with the introduction of Constraints to determine the optimal mix of programs given the current economic downturn.